Tracking the Game: Game Flow and Score Difference
By Jack Van Deventer • August 24, 2021
Introduction. The focus of this post is the graphical charting of Score Difference in the context of game flow, as a means of dissecting and analyzing team performance. A key topic herein has to do with Scoring Streak Analysis.
What’s Most Important? It doesn’t matter if your team scores 100 points per game if your opponent is scoring 120. What matters is the Score Difference at each stage of the game and the causative factors that created that difference. As I’ve stated in a previous blog post the objective for every game is to win, therefore the coach’s mission is to manage the team in a way that maximizes the Scoring Difference between your team and the opponent.
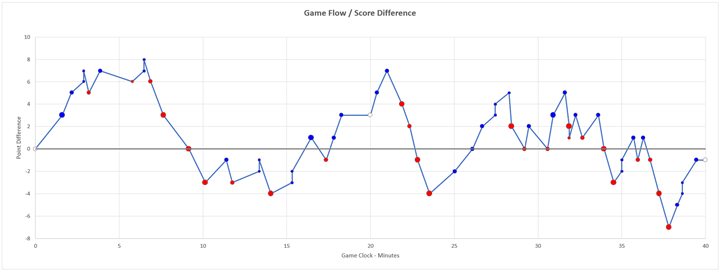
Charting a Major Upset. Below is a chart we developed and use at BasketballScience.Net for game evaluation. This particular chart details a stunning upset of a Top 10 college team (blue dots) at the hands of an inferior opponent (red dots). More specifically, it details the Nov 27, 2020 game where the University of San Francisco (USF) upset the (then) #4 ranked University of Virginia (UVA) on a neutral court.
What can you discern from this chart?
First, notice the meaning. Blue dots represent scores by the “focus team,” in this case Virginia. Red dots are scores by the San Francisco. Large dots are 3-point shots made, medium dots are 2-point shots made, and small dots are free throws made. Above the gray line, the focus team is winning. Below the gray line, the opponent is winning. White dots represent the existing score at period breaks and at the start/end of the game.
Scoring Streaks are Key! Why did UVA get upset? Because of notable scoring streaks by USF.
This 40-minute game was dominated by 3 scoring streaks (totaling a mere 6 minutes!) in which USF outscored UVA 30-0. Though Virginia controlled much of the other 34 minutes, it wasn’t enough to win the game.
Scoring Streaks: The Hidden Secret to Winning. Like a boxing match that goes 15 rounds, sometimes the outcome is decided by a flurry of punches landed in a short amount of time. The same is true in basketball. Whereas the game is dominated by back-and-forth scoring, the difference is often in the scoring streaks.
Which 5-player group on your team is most capable of generating scoring streaks? Which group of 5 is most susceptible to scoring streaks by opponents? Which group is most capable of stopping an opponent’s streak?
At BasketballScience.Net, we can tell you.


